Powerful scientific data visualization capabilities
| Sample | Note |
|---|---|

|
3D surface plot of regular data (41*29 points here) |

|
3D surface plot of irregular data (5 points here) |
| Sample | Note | Sample | Note |
|---|---|---|---|

|
Grid + vertex |

|
Cylindrical surface |

|
3D flat surface |

|
Spherical surface |

|
3D surface + 3D grid |

|
3D surface + contour map + color map |

|
color mapping is used |

|
4D surface |
| Sample | Note | Sample | Note |
|---|---|---|---|

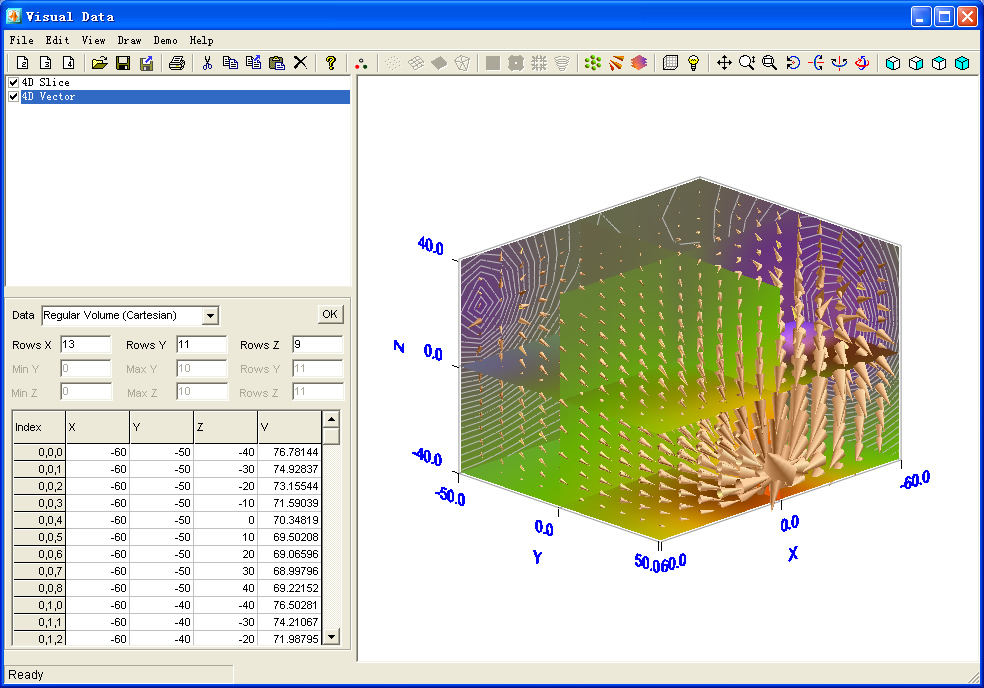
|
Contour map + vector plot |

|
Color map + contour plot |

|
3D surface + 3D contour map |

|
3D surface + 3D contour map (on 4D Cartesian surface) |

|
3D surface + 3D contour map (on Cylindrical surface) |

|
3D surface + 3D contour map (on Spherical surface) |
| Sample | Note |
|---|---|

|
Delaunay triangulation based on irregular data (flat surface) |

|
Delaunay triangulation based on irregular data (smooth surface) |
Explore Visual Data's powerful visualization capabilities
Download Visual Data today and start creating stunning scientific visualizations for your research and analysis.
