Creating 2D function graphs, animations and table graphs on Function Grapher
| Feature | Sample | Note |
|---|---|---|
|
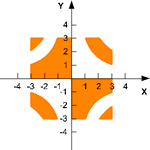
Functions can be in the form of explicit, parametric, piecewise, implicit and inequality |


|
Explicit form: Parametric form: Parametric form: Piecewise form: Implicit form: Inequality form: |
|
Cartesian and polar coordinate systems |


|
Cartesian coordinate system: Polar coordinate system: |
|
Coordinate graph animation |
|
sin(x*y-t)=0 |
|
Use table data to create 2D line graphs |

|
|
|
Scatter plot |

|
|
|
Curve smoothing |

|
|
|
Step plot |

|
y=sin(x)^2 |
|
Stem plot |

|
y=sin(x)^2 |
See Function Grapher in action

Operating System: Windows 11, Windows 10, Windows 8, Windows 7
Download Function Grapher today and start creating stunning 2D and 3D function graphs for your teaching and learning.
